30 August 2013
As of August 30, 2013, the activities of Digital Humanities Observatory (DHO) have ceased.
The Royal Irish Academy/Acadamh Ríoga na hÉireann champions research. We identify and recognise Ireland’s world class researchers. We support scholarship and promote awareness of how science and the humanities enrich our lives and benefit society. We believe that good research needs to be promoted, sustained and communicated. The Academy is run by a Council of its members. Membership is by election and considered the highest academic honour in Ireland.
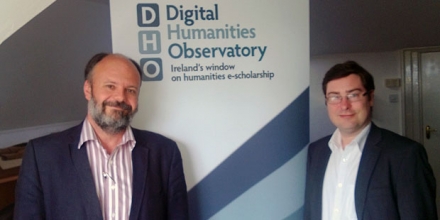
Read more about the RIAThe Digital Humanities Observatory (DHO) was an all-island digital humanities collaboratory working with Humanities Serving Irish Society (HSIS), national, European, and international partners to further e-scholarship. The DHO was a knowledge resource providing outreach and education on a broad range of digital humanities topics. It provided data management, curation, and discovery services supporting the long-term access to, and greater exploitation of, digital resources in the creation of new models, methodologies and paradigms for 21st-century scholarship.
As of August 30, 2013, the activities of Digital Humanities Observatory have ceased. The DHO staff of prepared a statement in relation to the cessation of the project.
Read more about the Digital Humanities Observatory
As of August 30, 2013, the activities of Digital Humanities Observatory (DHO) have ceased.
The Digital Arts and Humanities (DAH) Spring Institute at University College Cork will provide an opportunity for students and lecturers to engage around digital humanities research challenges.

On Thursday, 22 November 2012, a new website, Reading East: Irish Sources and Resources, was launched at University College Dublin.
Any queries about this project should be directed to the Royal Irish Academy at info@ria.ie